In Muscle Oxygen Testing in Endurance Sports – Part 1, I gave a brief explanation on why measuring muscle oxygen trends, specifically with a Moxy Monitor, is a useful tool in endurance training. This week I’ll go over one of the basic tests we can do.
There are two protocols I have been testing out with athletes. The first is a simple graded exercise test, where we ramp the effort every 5 minutes and watch the muscle oxygen (SmO2) trends. This is the test I’ll talk about today. The second is one that the Moxy physiologist recommends as a way to monitor muscle oxygen trends during efforts and recovery, and that will be discussed in the next post.
The basic step test is a good one to do when you don’t know the athlete’s threshold power or threshold heart rate. To perform this test, pick a starting power low enough so that the athlete warms up as a part of the test, and have an appropriate step in power for each stage that all “zones” are covered but keep the test to under an hour.
Once the starting power and steps are determined, all the athlete has to do is pedal and hit the goal power targets. It’s helpful to have software that displays SmO2 and a smart trainer (something like a computrainer or Wahoo KICKR) so you can view all the data live and the athlete simply has to pedal. Once the SmO2 falls off substantially, the test can be stopped.
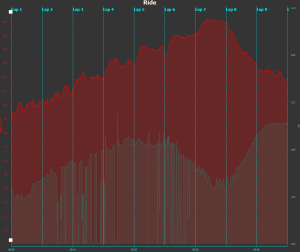
Below is one athlete’s heart rate and SmO2 data from a step test (red is HR, lower curve is SmO2.) This athlete was not used to training with power and wasn’t done on a “smart trainer,” so the heart rate varied a bit within the test as they dialed in effort. But you can see the standard general trend…heart rate increases linearly with increased effort (power not shown on this chart). Vertical lines indicate each 5 minute step.

Let’s now look more specifically at the SmO2 curve from the Moxy monitor placed on her left vastus lateralis muscle.

Initially we see an increase in SmO2 as the test progresses, and this is what we expect to see. This upward slope tells us that her oxygen supply is sufficient and exceeds the demands of her muscles. (We also collected data from the right to see if we got a similar trend. I won’t go into that now, but assuming the sensors are put in the same location on each leg, we can learn a little about possible left/right imbalances.)
From the information provided on two charts, we see in the end of stage four and throughout the fifth stage the SmO2 curve levels off. This indicates the athlete is at a balanced point where oxygen delivery matches consumption. As the athlete’s heart rate continued to increase in stage 6, we see SmO2 start to fall, and it indeed keeps falling into the next stage. At this point we end the test and I allowed the athlete to easy spin for recovery. During this recovery, we see the SmO2 trend slopes positive again until it levels off again.
This particular athlete was training for an iron-distance triathlon, so the test results were quite useful in giving us some heart rate limits for the bike portion of the event. The athlete was to spend most of the time at the end of the increasing stages (stage 4) and not be afraid to be a little in the beginning of the flat zone (stage 5), but stay away from the heart rate that we saw in stage 6. (This athlete did just that and had a successful race!)
We could also use this data to establish heart rate and power-based training zones. The step test is just one way we can use SmO2 to understand what’s happening inside the muscles during physical activity so training programs can be better customized to see performance gains.
In Part 3 I’ll talk about the other common Moxy test protocol, the 5-1-5 test. Want to get “Moxy tested?” Contact me!


