There’s a relatively new piece of software out there that I have found to be a valuable tool working with triathletes, time trial cyclists, and my own racing. The software is an online tool called Best Bike Split. What this software does is predict a cycling time trial based on your bike/bike fit, FTP, the course, and weather data. (It’s an extremely sophisticated model!)
I have found the estimated splits to be quite accurate, even with estimated information. I’m going to talk about how it’s extremely helpful to aid with race planning, especially those doing long-distance triathlons where hydration and fueling is critical.
I recently raced the Syracuse 70.3. As this was a destination race, I was not familiar with the course other than online elevation profiles and course video. I had no idea what my bike split would be. So here’s how BestBikeSplit.com worked for me.
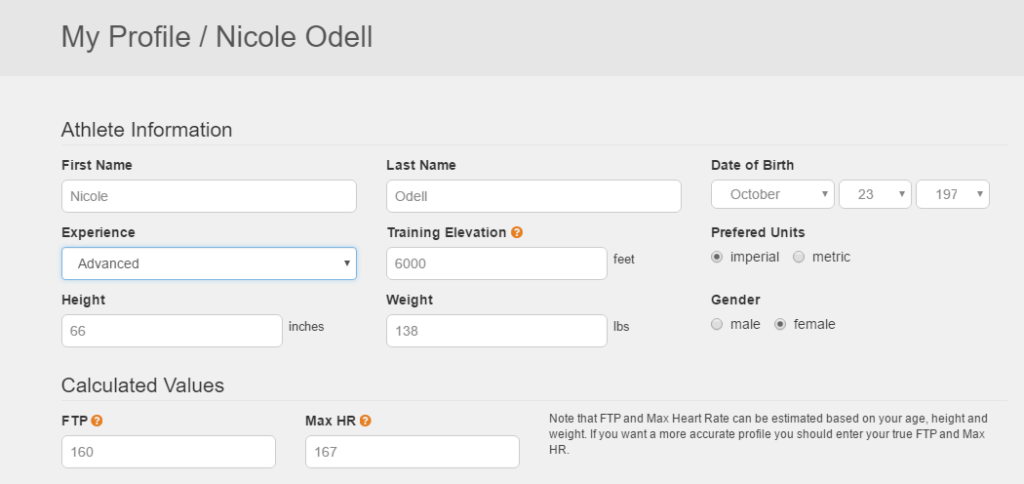
I have a basic profile set up:
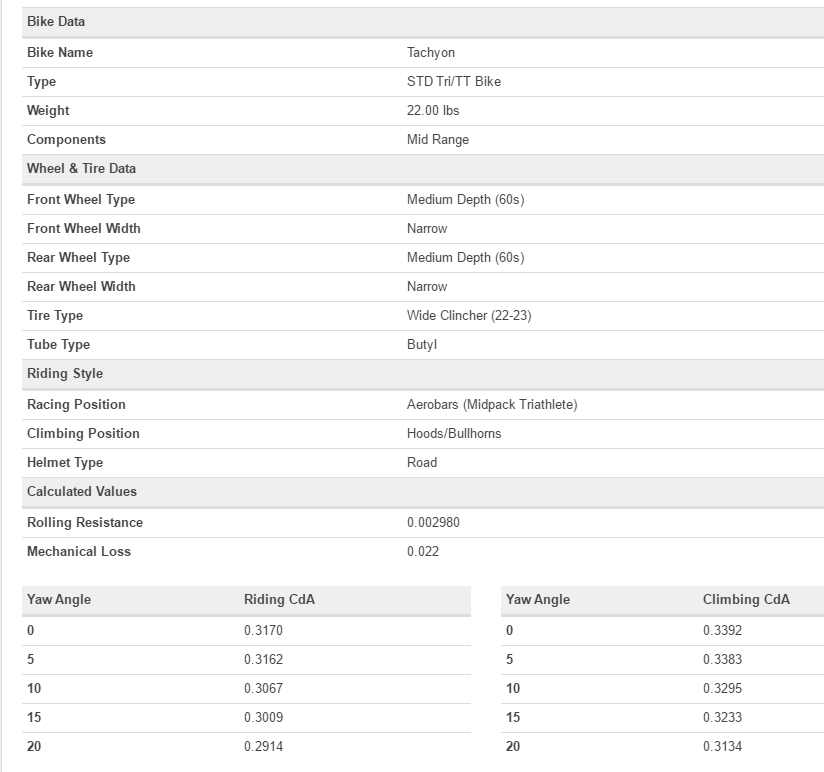
I also have a bike profile. You can set up multiple bikes in your account, but this is my TT bike.
Don’t be freaked out by the info, there are a lot of drop-down options to choose when setting it up so you just need to know some basic information about your bike and how you ride. The bottom numbers are all calculated. If you have your fit data, you can enter that instead of using the riding style. This is for the CdA or aerodynamic drag, an important piece of the model.
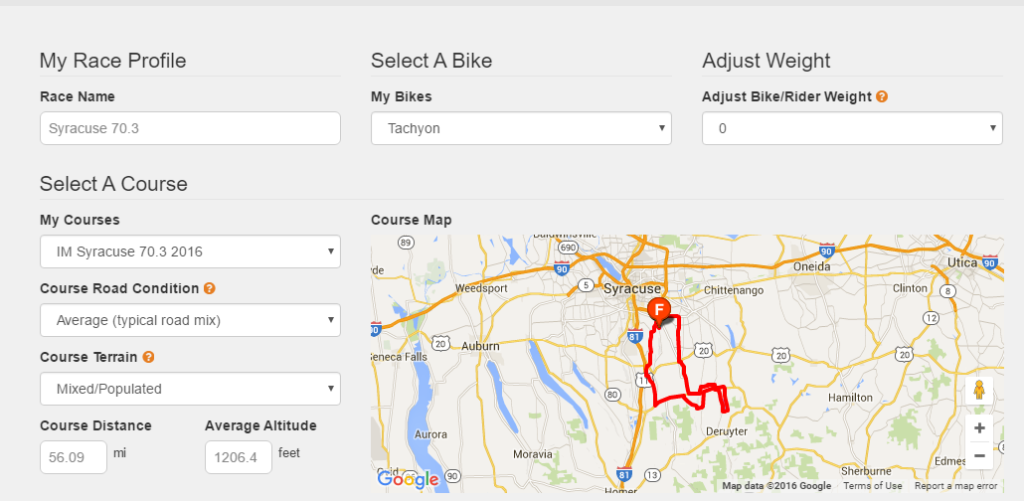
The next step was to add the Syracuse course to “my courses.” I searched their course database and found it. If a course isn’t already in the database, you can add it with a .GPX or .FIT file.
Next was to add the race. When you do that, you set up a variety of variables, but again, it’s straightforward. The first section of setting it up looks like this:
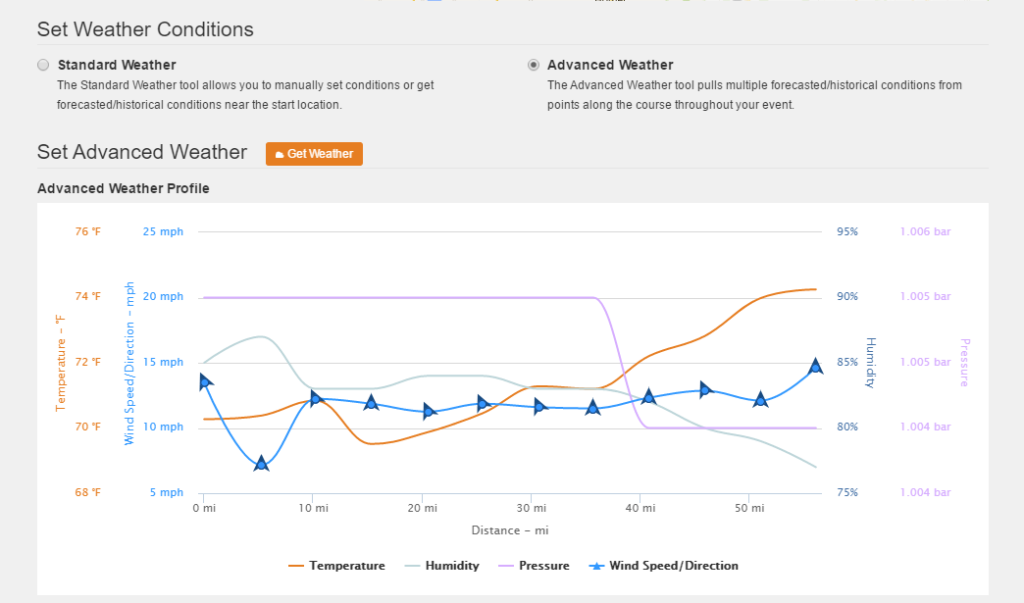
The next part is how you want to model the weather. I always use advanced weather.
The advanced weather asks for a date and time. I knew my wave start time for the swim, so just estimated my swim +T1 time to get an approximate starting time for the bike. Because wind conditions change throughout the day, I like to get this as close to actual as I can.
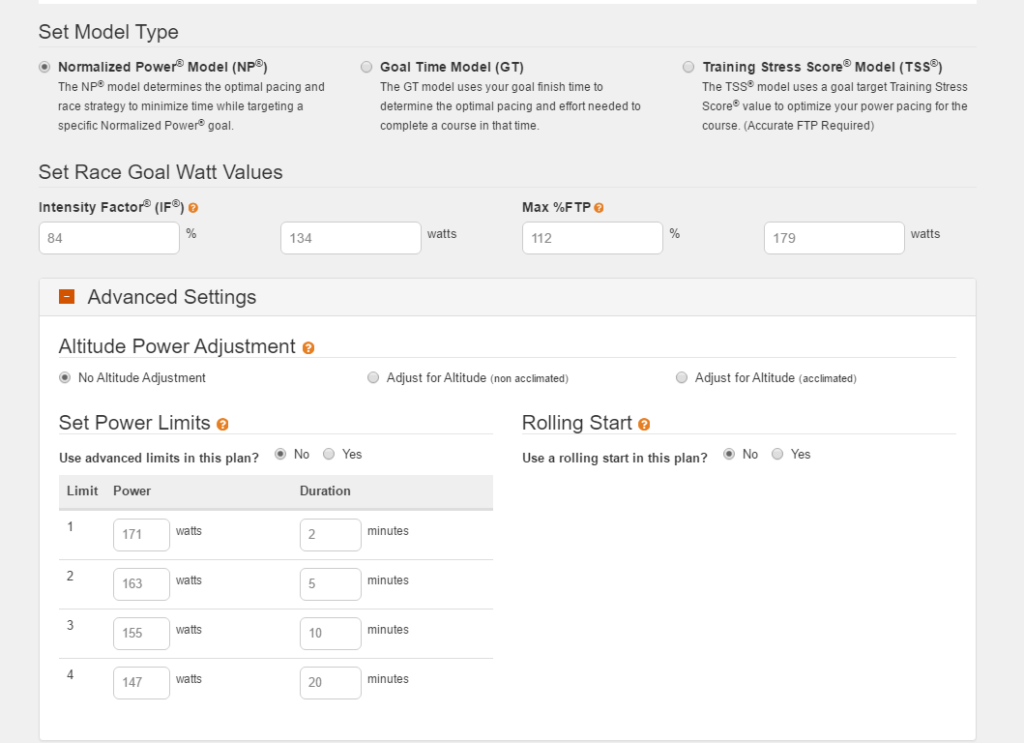
The final thing to set up in your race is the model type – are you aiming for a specific intensity factor, TSS, or a goal time? (You can see this would be useful to check what your power output would have to be to hit a specific time and compare that with what you “should” be riding for your race in terms of power.) This will help you set realistic goals!
I did not adjust for altitude in this model, but could have as I train at 6000+ feet.
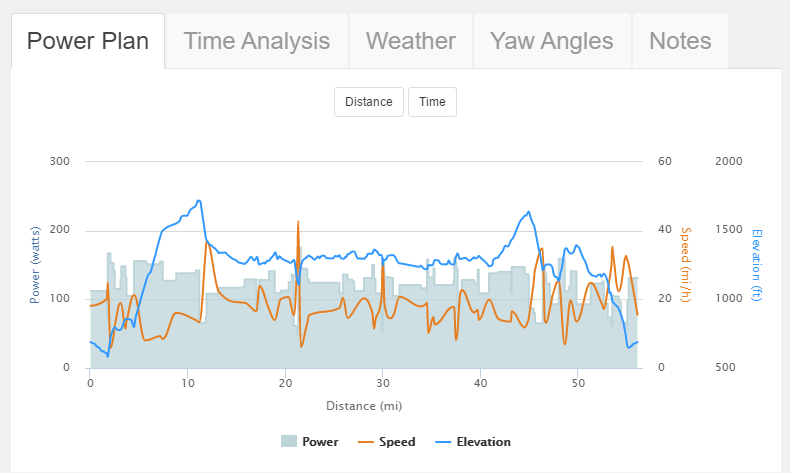
After this is set up, we click a button to calculate the race plan. Then we get the following output.
I get a graph of calculated speed, the power I should be holding mapped on the elevation profile.
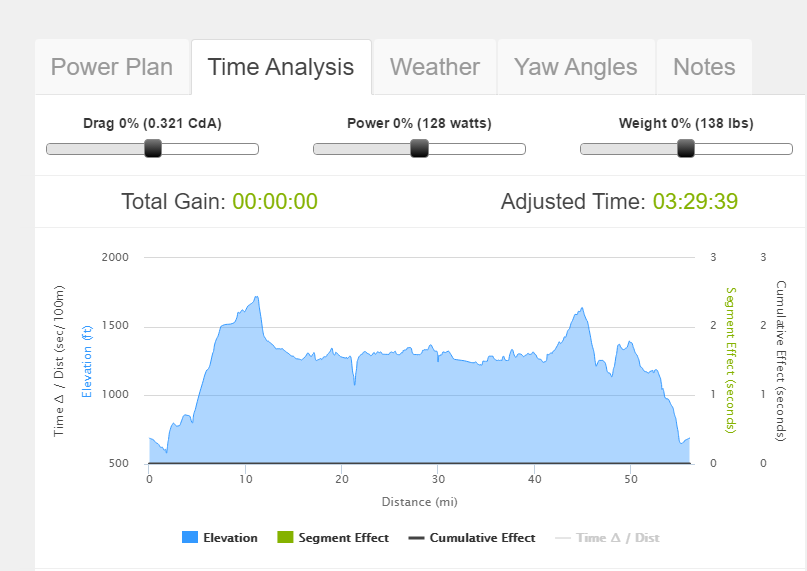
The Time Analysis tab shows me this:
The sliders are nice, at it allows you to see what happens to predicted time by adding/subtracting weight, changing power (say you asked “what if I rode 5W less, how would that affect my time?), and changing drag.
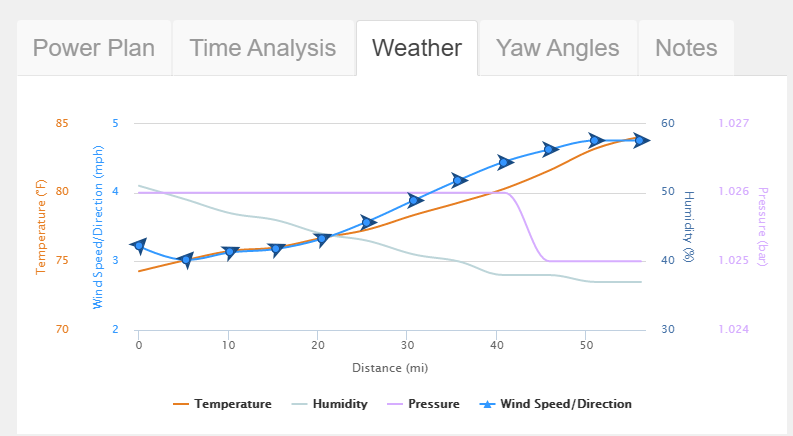
The weather tab shows us predicted wind speed and direction, temperature, and humidity. Because weather models are more accurate the closer you are to what you’re modeling, it’s a good idea to update the race plan the night before your race to check what most likely happen while you are racing.
Other sections:
Yaw angle is calculated from wind direction, speed, and your speed. It’s important to the model, but for our purposes today, we won’t worry about it. Notes is where you can add in comments, perhaps where the aid stations are, or when you hope to eat.
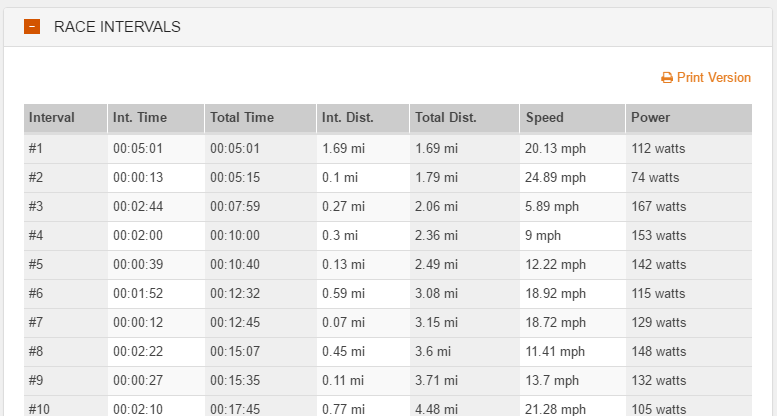
You also get a very detailed table of time, distance, speed, and power. For a long race like a half-ironman on a course with lots of hills, it’s big. I’m showing below 10 segments of 83 in the race plan.
To make it a little easier than trying to remember 83 intervals, we can use the cheat sheet it provides to get power ranges for flats, descents, and hills of various grade. Link to this race cheat sheet: https://bestbikesplit.com/hints/41284
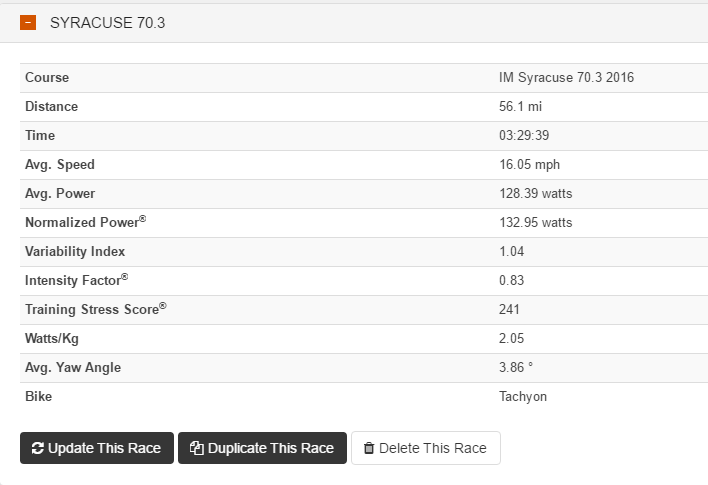
Next we’ll look at the plan summary:
The above is what was predicted for me. So assuming I ride consistent to the power plan, my time was predicted at 3:29. I will be honest, I was a bit surprised, and was hoping the model would be wrong as to date my slowest 70.3 split was about 3:06. But this was going to be a hilly course with about 3,000 feet of climbing. I’ve had good luck with the BBS models in the past, so I had to consider the model correct. When I was finalizing my personal race plan, I made sure my nutrition and hydration plan would be sufficient for about three and a half hours on the bike.
The plan also give you a public link that you can share with some of the basic plan info. View the public plan here: https://bestbikesplit.com/public/41284
Race day: I rode a 3:27. I didn’t stare at my power output, as I rode mostly on feel, but over the course on the “flats” I would check to see that my 10s average power was between 130-135W to make sure I was in the right place. I had some power glitches so my ride data wasn’t completely accurate, so I couldn’t go back after the fact and put in my exact power. But I could re-do the model based on goal time and put in my actual time to see if the predicted power seemed feasible, and it did.
Some (but not all) sources of variation in the model versus reality. (In addition to not riding to the power plan):
- Riding differently than your stated style (for example, too much time on the bull horns on flats, affecting CdA.)
- Slowing down for aid stations
- “Traffic” that makes you adjust pacing slightly to avoid drafting.
- Errors in CdA that might come about if you are just entering general bike info versus specific fit data.
- Exact start and stop points might vary.
BestBikeSplit allows you to download a variety of file types for use with “smart” trainers. Had I done it sooner, I could have “pre-ridden” the course in the comfort of my home on my Wahoo KICKR. There are also quite a few more features in the software that I didn’t touch on, such as side by side race comparisons. What I described is probably the most basic way to use the software to help with race planning and training. I should mention there is a free version and a paid premium version, in addition to a coach edition. I use the coach edition, which gives me the premium features, and the ability to have athlete profiles attached to my account so I can review their races.
In summary, the software predicted a 56 mile ride within about 2 minutes. This, in addition to previous races I’ve reviewed, convinces me it’s a very useful tool. I certainly plan on incorporating these models with more of my athletes and my future races.

