“What gets measured gets done/managed/improved.”
This saying has been around a while…it’s often used in business to help make sure the right resources are being spent on the right tasks to get the right things done and done well.
Metrics are of course also very applicable in the world of endurance sports. The most basic of metrics are your race results. The goal is usually to get faster. And to do that we monitor things like training paces, bike power, and heart rate, and maybe even muscle oxygen. If we want to get better, we know we have to watch numbers to gauge the improvements we make while executing our plan. If we don’t see improvement, we adjust our plan.
In addition to specific training or workout metrics, there are other useful metrics we can track to help us become better athletes or just have a better feel for our health, which ties into quality of life. For example, if you have high blood pressure, you should measure it regularly it to make sure your plan to bring it down (change of diet, exercise, possibly medication) is working.
TrainingPeaks (the software platform I use for monitoring training data) has a TON of metrics you can track. And now that it’s getting towards the off-season, why not spend some time with it to get it customized for your needs?
Let’s take a look at how to use TrainingPeaks…
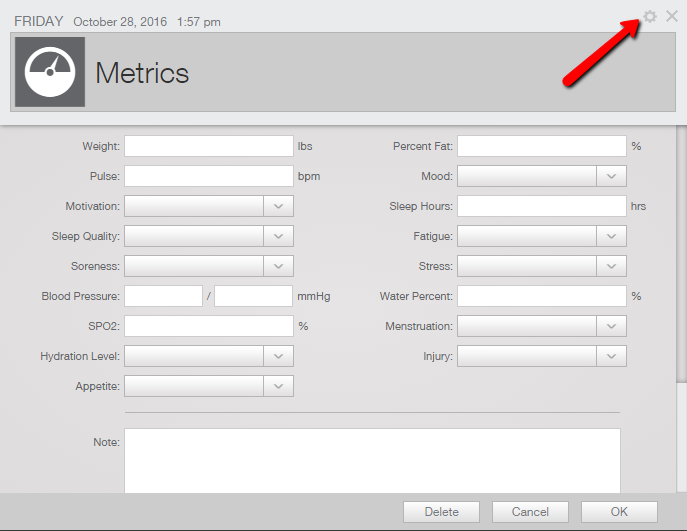
First, when you are in calendar view and click the + to add something on a particular day, you get this pop-up:
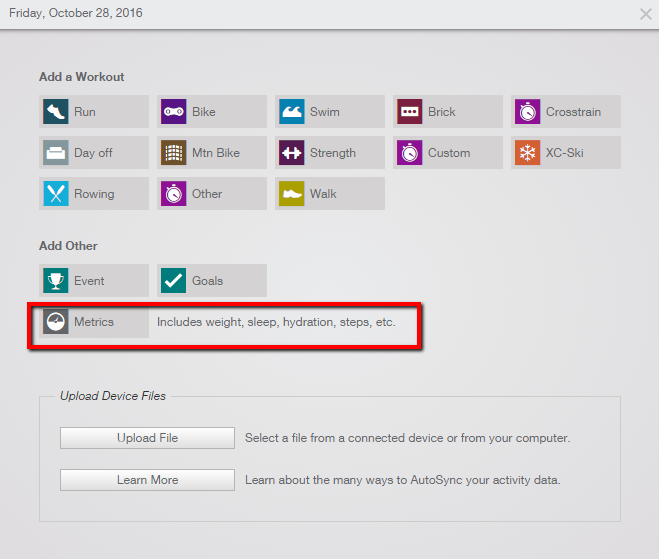
Click the metrics button and you’ll get a box like below show up. If you’ve not set it up at all, you’ll see the default metrics. To customize it, click the settings gear icon in the upper right corner.
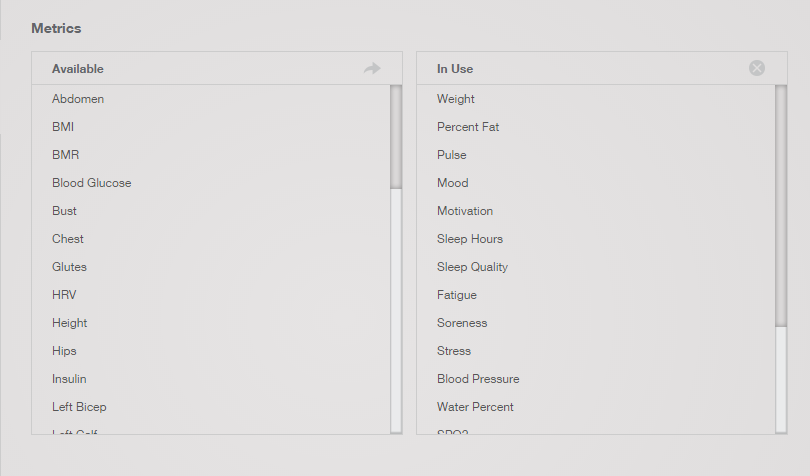
Your account settings will open, so just scroll down until you get to the metrics section. Then you can drag and drop from Available to In Use and the other way around. You can also drag them into any order.
Once you’ve figured out what you want (you can go in and update this at any time), click Save and Close at the bottom of the settings box, and you’ll go back to the screen you were on.
Now we need to set up the charts so we can view the metrics we are tracking.
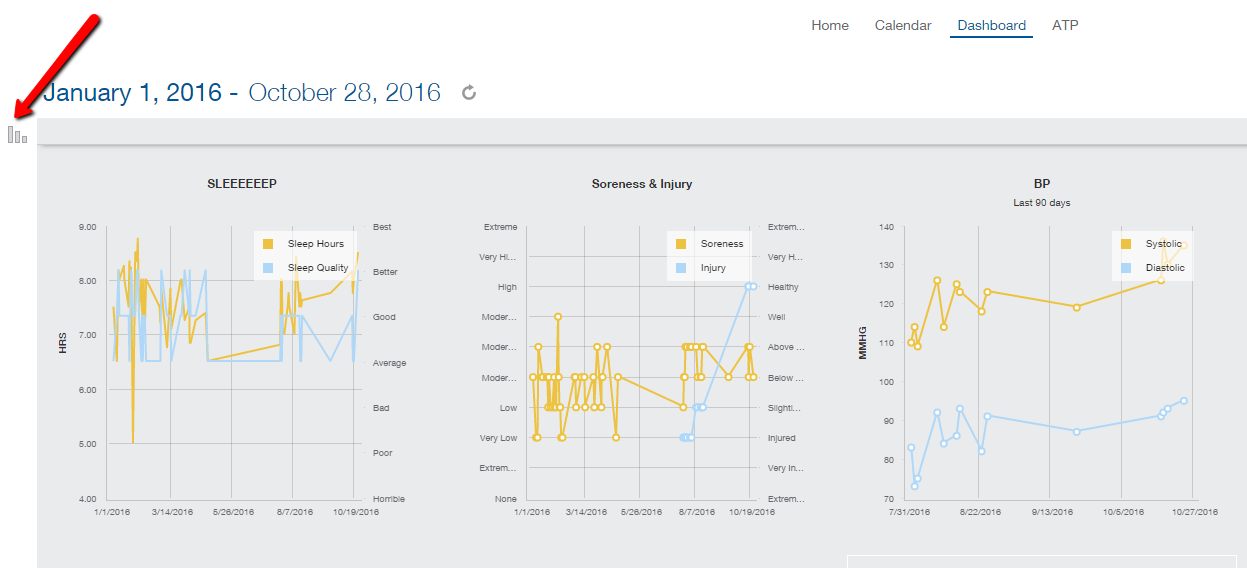
At the top of your screen, click Dashboard. If you’ve not set this up, you’ll just see the default. We want to add metrics to the Dashboard, so click on the charts icon in the upper left:
That opens up the chart selection and you can scroll down to pick “Metrics.” All metrics are under this chart type. You can add as many of the ‘Metrics’ charts as you need and customize them.
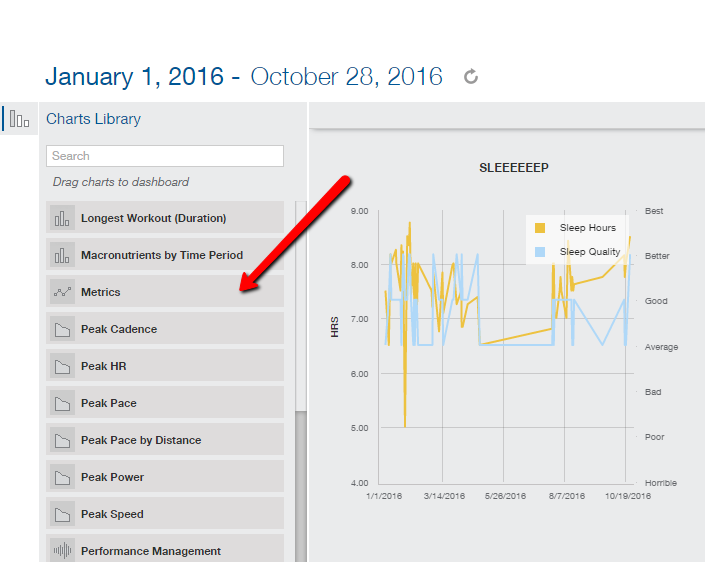
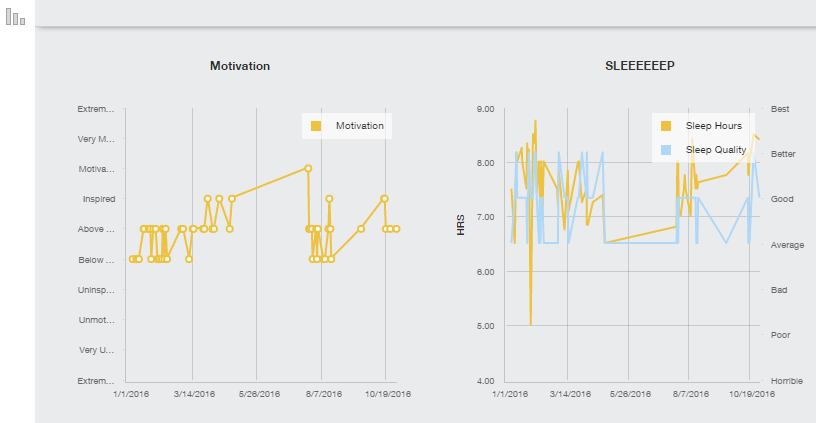
Once you drag a “metrics” chart to your dashboard, click the settings bar in the upper right corner of the chart to customize it to the particular metric(s) you want to see.
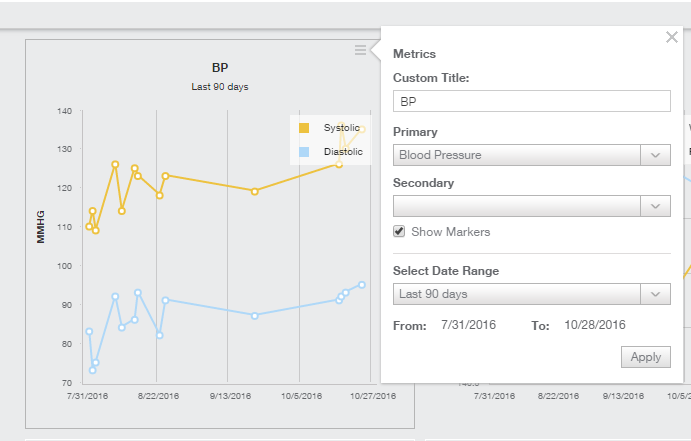
You can change the title, have two different metrics on the same chart, and customize the date range you view. You have a lot of flexibility here to monitor a lot of different trends. Once you click ‘Apply,’ just click the X in the upper right to close out the chart settings box.
If you start getting in a daily habit of logging things like how much sleep you got the night before, your fatigue levels, and a few other things, you’ll get some good insight to what might be affecting your performance. The key is to make it a habit. It doesn’t take long once you have it set up, so the off-season, when things might be a little quieter, could be a good time to start if you aren’t already.
What metrics do you track and why? Let me know in the comments below!