Last October, TeamNEO Athlete, Khem, competed in Kona at the IRONMAN World Championships. After such an endeavor, a bit of a break is usually in order. So her fall and winter were spent keeping things pretty unstructured. She skied quite a bit, with a little bit of swim, bike, and run mixed in so she wouldn’t forget how!
But while the intention was to do a slow 2016, she happened to sign up for a June half-IRONMAN. That meant we had to get her back with some structure and back with some bike training.
To help with some bike motivation and intensity work, Khem signed up for a local time trial series. This data would would give us a good benchmark for where she is fitness-wise, and also force some pretty quick training stimulus. Let’s look at her data from the four events she did.
Time Trial series #1: Her first stand-alone cycling time trial
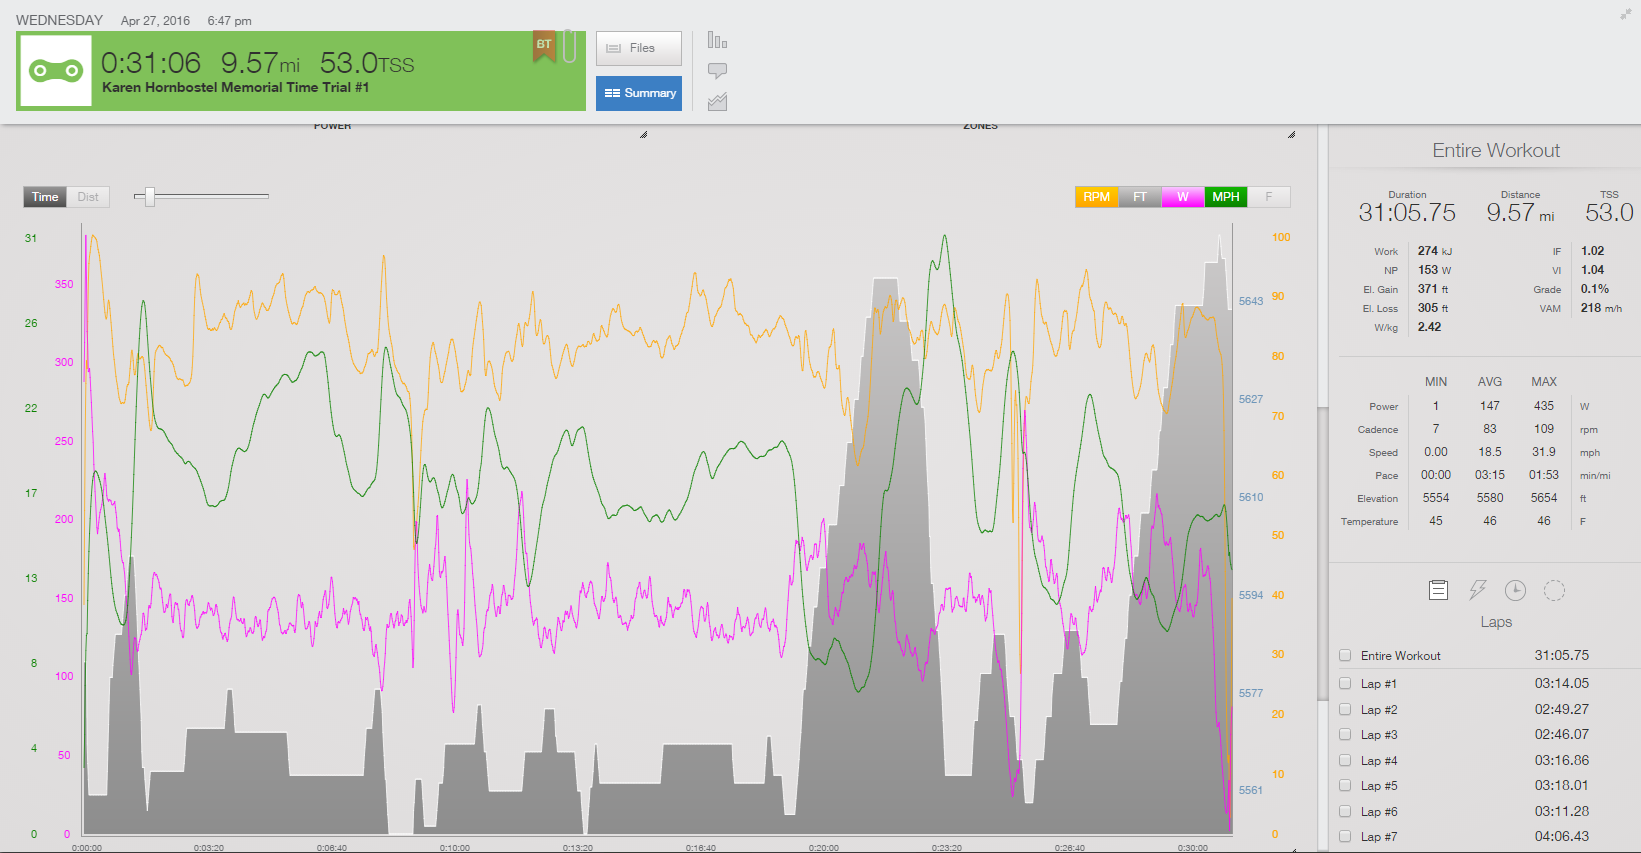
The first thing we notice is that she started really hard. It’s typical to see a spike in power as you explode off the start but she has a bit of time over 200W, which for her isn’t sustainable. She then settled into a much more steady output, and kicked it up the second half.
Time Trial series #2 the next week.
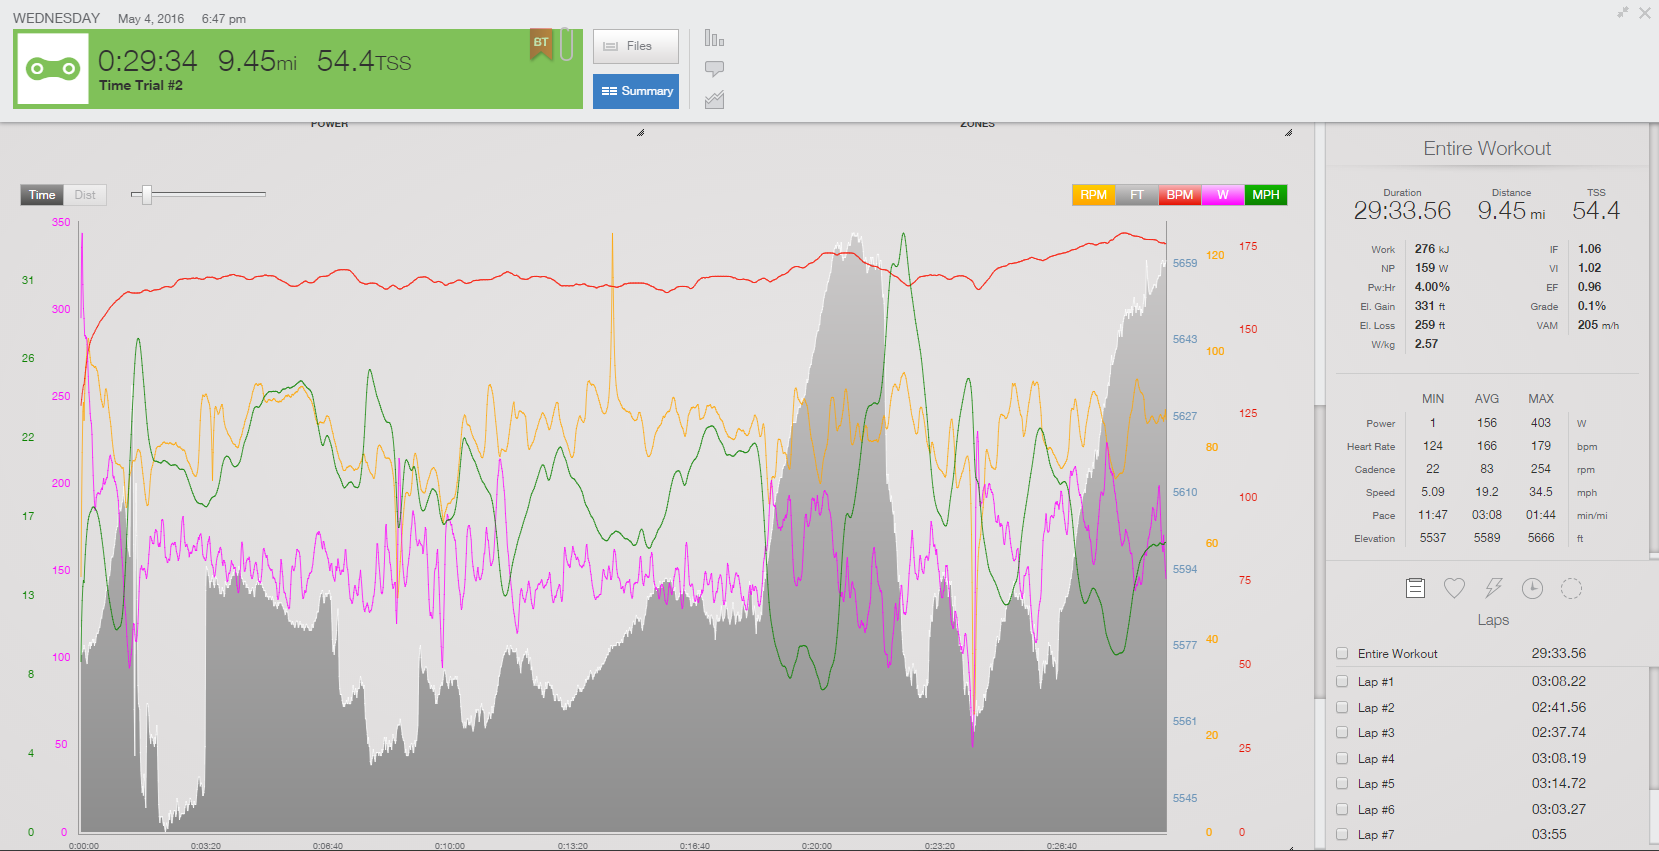
One week later was the next Time Trial series, and here she bumped up her performance. She still had a pretty hard effort at the start on the short climb, but not as high as race #1, and once again settled into a steady effort. She beat her previous performance (normalized power) by 6W, but her VI went from 1.04 to 1.02, which is great. While the back-half power doesn’t look smooth like the front, the terrain has something to do with this (and it’s a short race.)
TT #3:
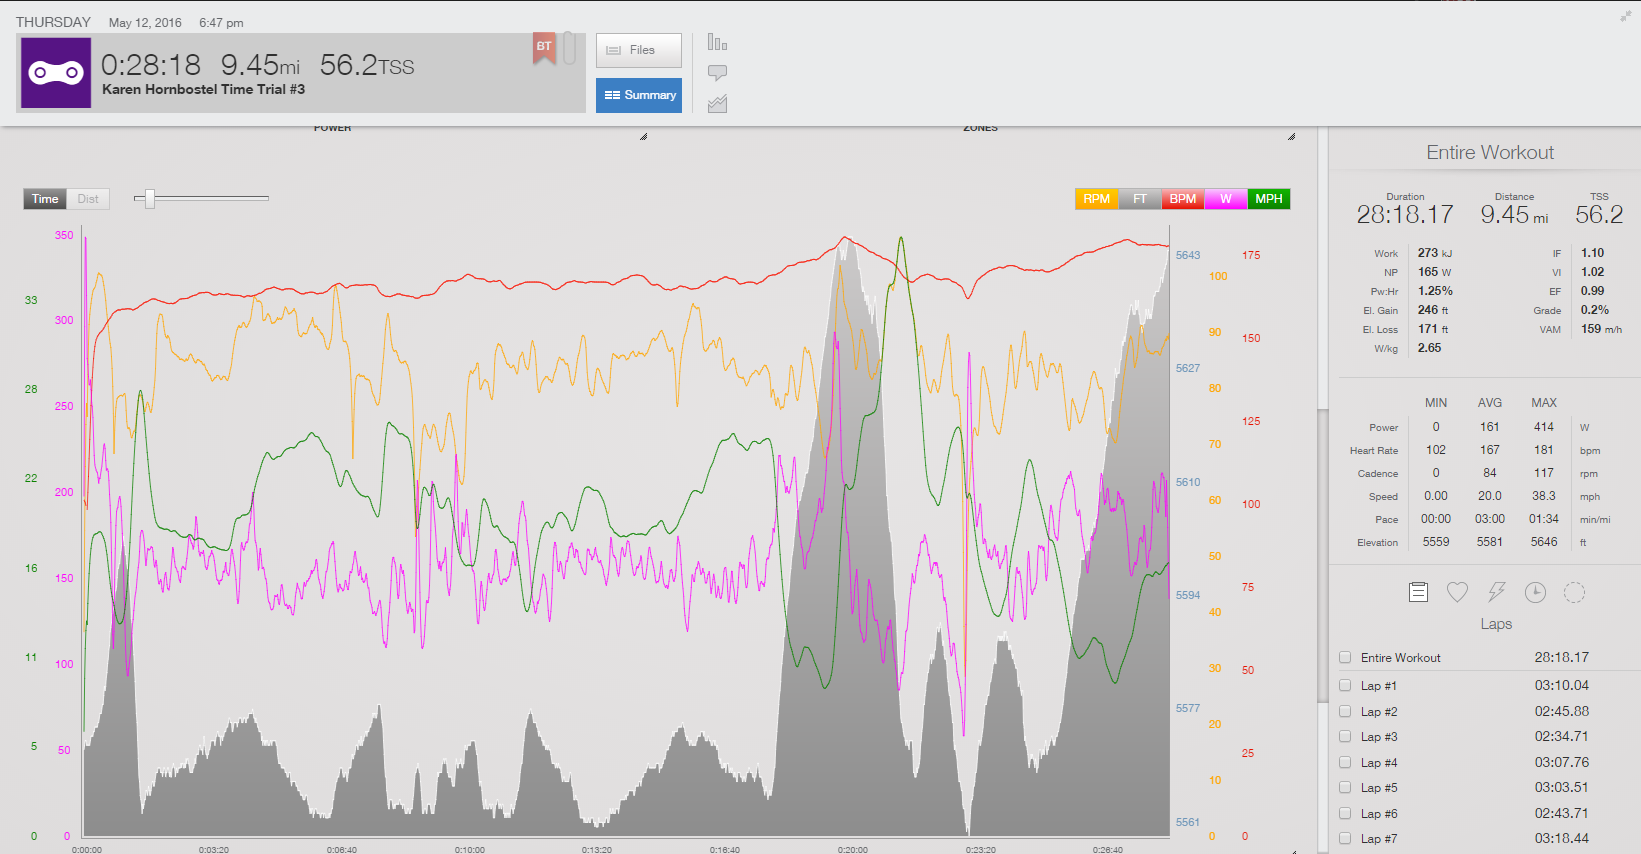
There was a week break and then the third race (shown above.) We see a similar power and heart rate profile to the previous weeks, but with a few more spikes (not ideal) and a slightly higher effort at the end. She bested her NP by another 6W, and had her fastest time once again. VI was 1.02.
TT #4
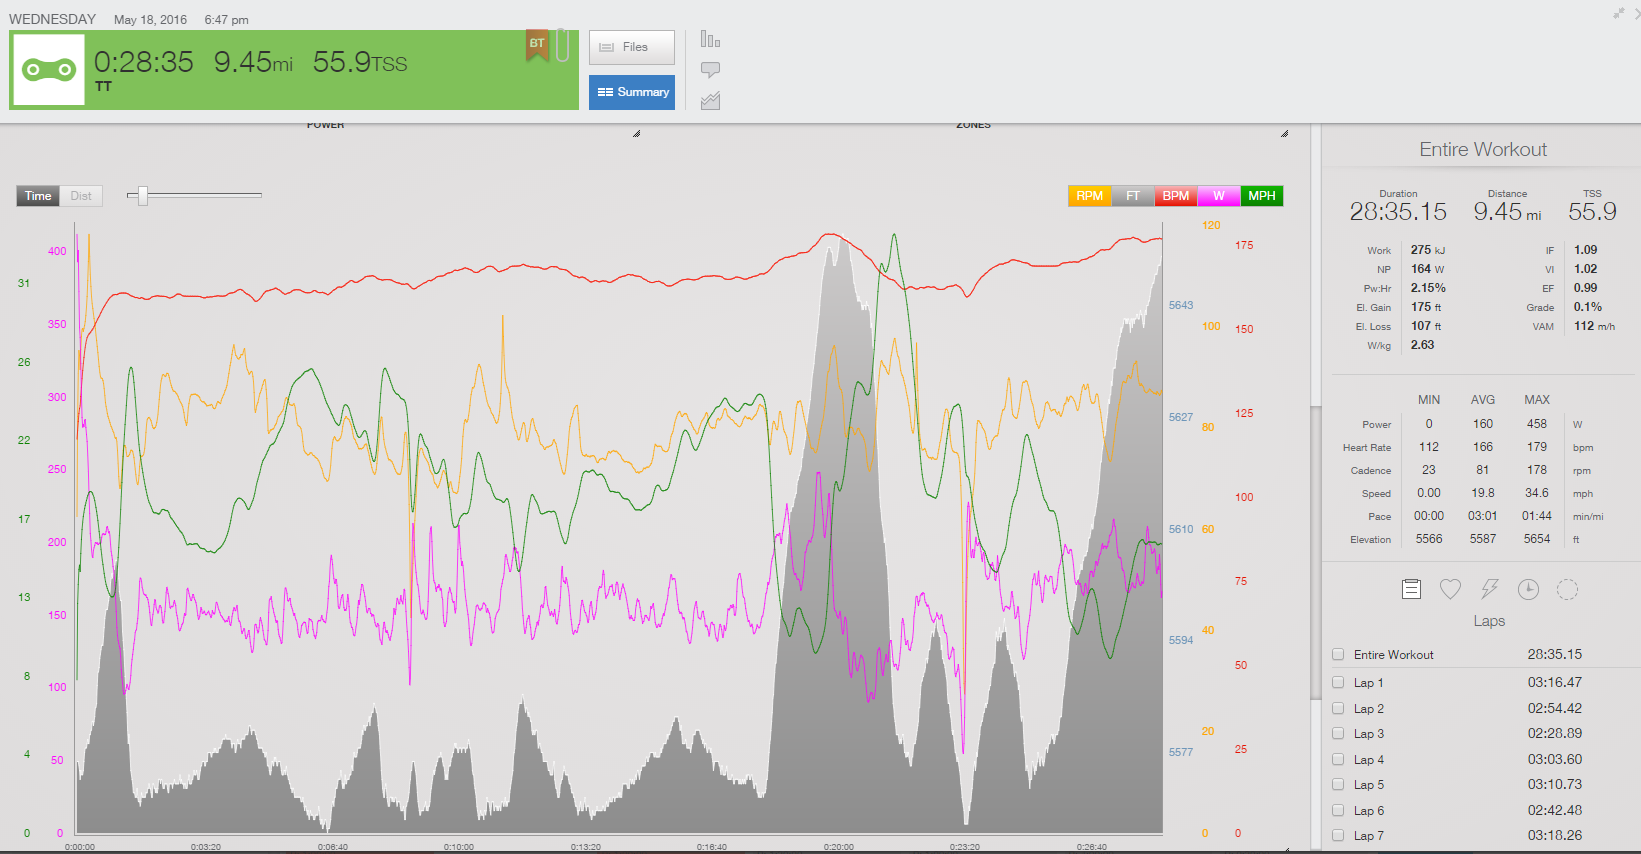
The data for this last race (only 6 days after the previous race) is similar to the 3rd race, which is not unexpected for a fairly fit person. A few weeks of improvement and then stead output. These were mostly her intense workouts each week.
What I’m looking for in the data
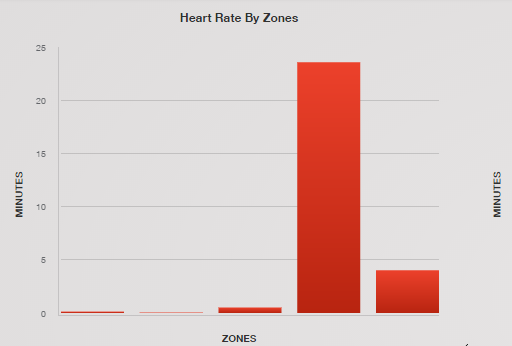
Heart rate:
In a Time Trial series, we should see heart rate rise pretty quickly and then it will stabilize, often with a slight upward slope, and should reach its maximum value at the finish when the athlete is giving everything left in the tank. This is what we see, with a little bump about two-thirds of the way through on climb. The profiles across the events are also quite similar, so it tells me she was most likely giving a consistent effort across all.
If we look at the time in zones, she quickly got to Z4, stayed there, and had a little time in Z5. This means we’ve got her zones set up well.
Power data:
In power data for a time trial series, we want a consistent effort, which will mean that average power should be very close to normalized power, and this is reflected in a low variability index. The closer it is to 1.0, the more steady the power was across the entire TT. Khem was learning the course and what she could do, which probably is why her first TT had a higher VI (1.04) than the remaining efforts (1.02)
A 30 minute TT power output should be somewhere around threshold/FTP or slightly above. Khem’s output is consistent with this and has actually achieved a slight bump in FTP.
Khem negative split these events with a slightly higher power on the second half.
Table of race comparisons:
| TT #1 | TT#2 | TT#3 | TT#4 | |
| Time | 31:05 | 29:34 | 28:18 | 28:35 |
| Speed | 18.5mph | 19.2mph | 20.0mph | 19.8mph |
| NP | 153 | 159 | 165 | 165 |
| AP | 147 | 156 | 161 | 160 |
| VI | 1.04 | 1.02 | 1.02 | 1.02 |
| Max Power | 435 | 403 | 414 | 458 |
| Avg HR | Not available | 166 | 167 | 166 |
| Max HR | Not available | 179 | 181 | 179 |
In summary, we saw what we wanted to: slight improvements across the first three races with a consistent strong output on the final race. We have her heart rate zones set up well, got a nice benchmark for threshold power, and achieved a fitter athlete!