Last Thursday I gave a presentation at Cafe Velo speaking about measuring muscle oxygen (SmO2) and demonstrated how a Moxy Monitor can be used to establish training zones.
Here is a high-level recap:
- The Moxy Monitor measures the percentage of oxygenated hemoglobin and myoglobin in the muscles.
- Monitoring this during training gives us insight into our oxygen delivery and utilization systems, which are critical systems during exercise.
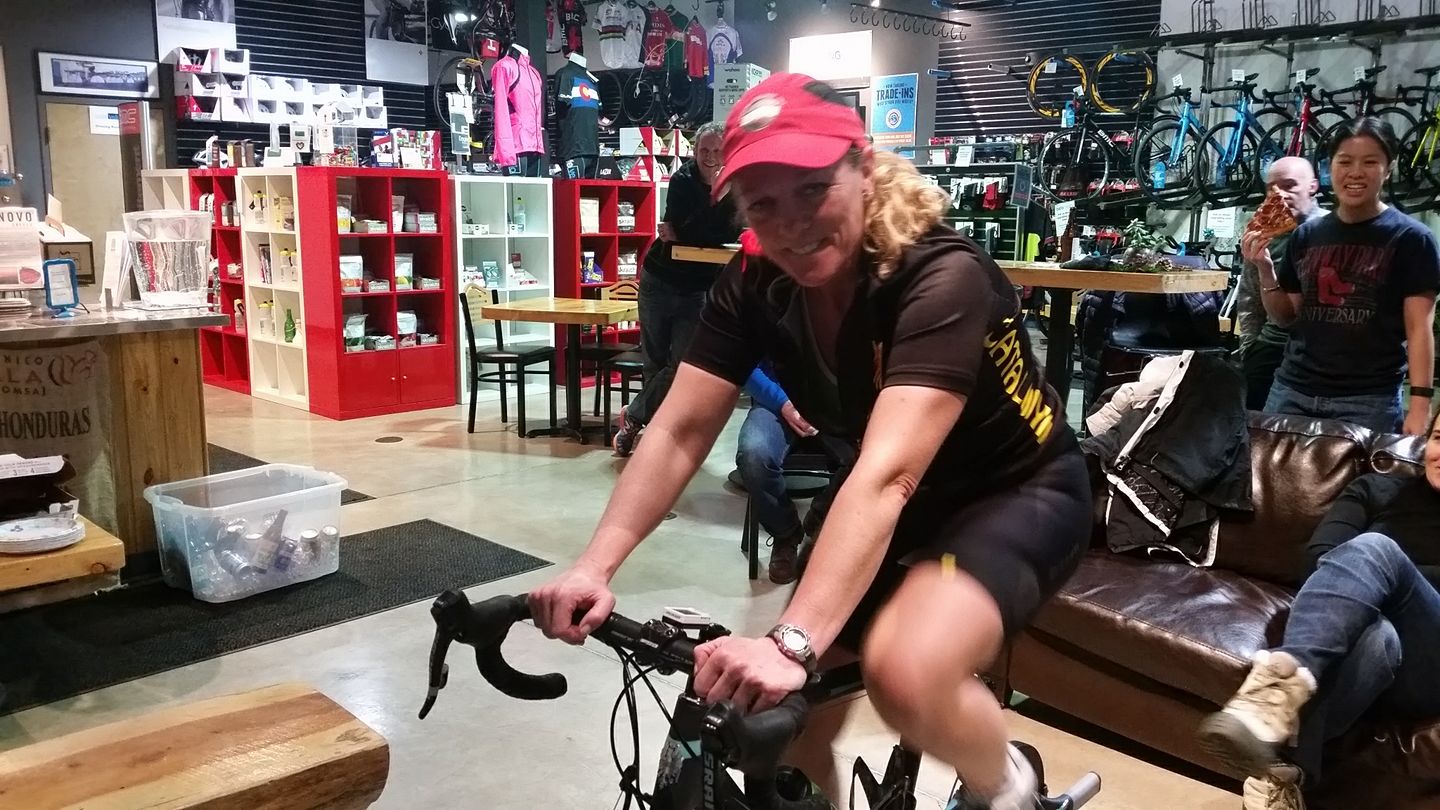
- We had an athlete do a live test, which is a graded exercise test or step test to demonstrate what happens to SmO2 levels at different intensities.
Here’s the video:
Now let’s look at the test data.
First, the power and HR data through TrainingPeaks:
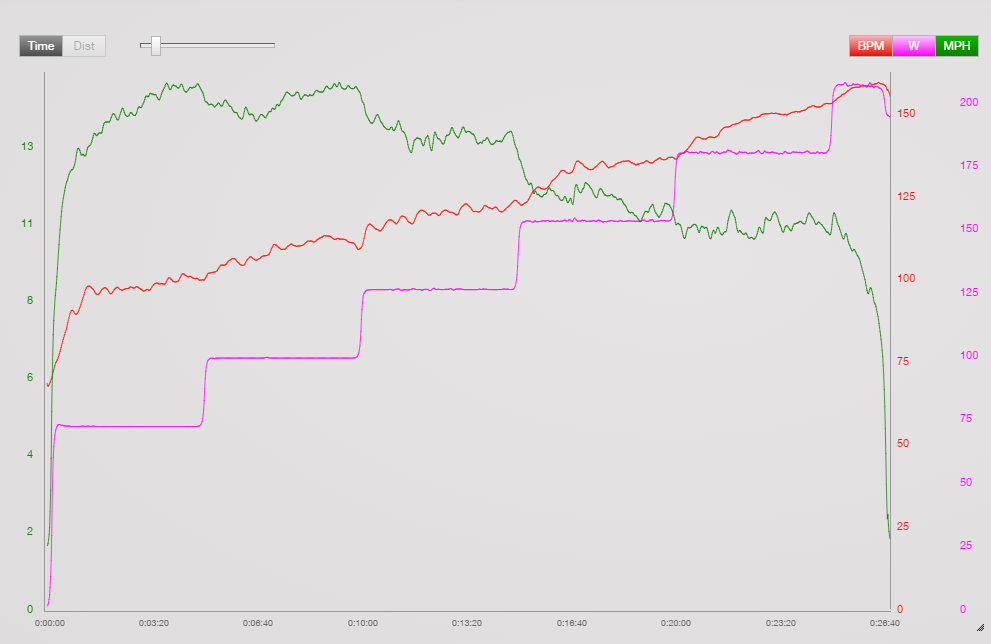
Pink = Power. I estimated her threshold at 180W and we started at 40%, moving up in 15% increments
Red = Heart rate. We see a nice linear response to the increasing power, as expected.
Green = Speed, which is really a reflection of cadence, as we didn’t have a cadence monitor.
The test was done on a Wahoo KICKR so it was set in one gear, therefore lower speed = lower cadence. Marisa was instructed to just pedal at her normal cadence. As it got more challenging, cadence dropped.
Here is the muscle oxygen and hemoglobin data:
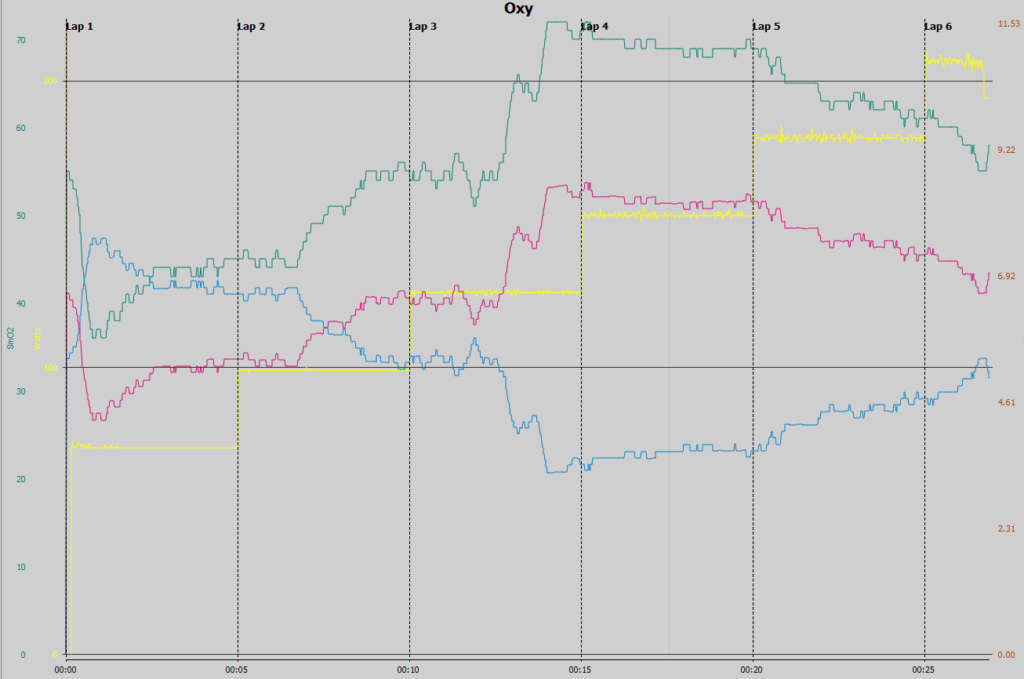
Teal line = SmO2
Yellow = Power
Pink = Oxygenated Hemoglobin (O2Hb)
Blue = Deoxygenated Hemoglobin (HHb)
Let’s look at each stage and see what happens. We’ll focus primarily on the SmO2 trend.
Lap 1, 72 W
What we see is an initial drop in SmO2 when she starts the test. This is because she is going from rest and suddenly put a demand on her muscles, so the initial supply of O2 does not meet the demand. Once her body realizes what is going on, SmO2 starts to go back up, as she is able to meet and exceed the demand at this stage.
Lap 2, 99W
At the increased load, instead of dropping like we saw in stage 1, SmO2 was stable (supply = demand) for a little over a minute, and then as the body reacted to the demand, SmO2 increased again. (supply > demand). At this point in the test, her rate of perceived exertion was in the 4-5 range (1-10 scale). It leveled off a little at the end of the stage.
Lap 3, 126W
Again at this start of the stage we see SmO2 hold steady as she’s keeping up with demand. What’s interesting in this stage is the sharp rise about half-way through. If we refer back to the first graph, we see speed (therefore cadence) is holding steady on this lap. Her body is essentially getting warmed up and prompting good delivery. We likely have good vasodilation here, as the O2Hb and tHb increases substantially as well. Her perceived exertion at this stage is between 5 and 6, and I will guess she probably spends a lot of time riding at this effort so her body is quite adapted to it.
Lap 4, 152W
At the start of this segment, SmO2 drops slightly at the beginning, but holds fairly constant in the second half of the lap. Even though the number is a little lower, she’s meeting demand. RPE at this stage was about a 7/10.
Lap 5, 180W
During this stage, we start to see the signs that usage exceeds delivery, as SmO2 starts to drop. RPE = 8+ at this stage. It’s a steady decline, but not extremely steep, which means she could hang out at this effort for longer than the 5 minute stage.
Lap 6, 206W
Here we start to see a much more significant drop in SmO2 at the start of the stage. Speed (cadence) drops significantly as Marisa is trying to maintain power. There is no need to try to continue the test at this point.
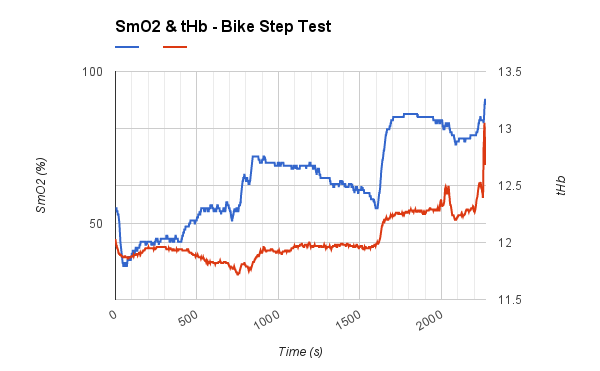
So once Marisa stops pedaling, there is an immediate rise in SmO2 and tHb (seen in Fig 3, as Fig 2 data ended when the test ended.) She went from placing an extreme demand for which her body was trying to support to nothing, so therefore the delivery of O2 exceeds the demand, and we get a higher SmO2 value. The remainder of the chart is her cool down, getting off the bike, etc. (The Moxy Monitor captures data as soon as it’s turned off and continues until it is turned off.)
What does this mean for Marisa and her training?
If we set up zones based on the muscle oxygen data, her Active Recovery zone will be anything under approximately 125W or heart rate <120bpm.
A Structural Endurance Intensity zone can be set up in the 125-150W range, or 121-135bpm.
A Functional Endurance Intensity zone would be in the 150-180W range, or 135-150bpm.
Her High intensity zone would be >180W, or HR > 150bpm.
How this impacts training:
Marisa could set up interval workouts to work specific systems that she would need for her events. If she is doing longer endurance races, the focus would be on STEI and FEI zones. If her races are shorter and require higher intensity (ie track racing), then some good work would be done in the FEI and HI zones. If Marisa were to use a Moxy Monitor when training, she’d would be able to monitor recovery (increase in SmO2) and also know when to stop doing the intervals, as when she wouldn’t be able to return SmO2 to its upper reference value.)
Capturing muscle oxygen data during training can really help fine tune workouts, as the athlete is able to see exactly what is going on at different intensities during the workout. You can learn more about physiology and the device used to capture the data at http://moxymonitor.com.
Feel free to contact me if you want more information about this!


1 comment
Very nice, clear simple straight forward start in the journey of using NIRS in any sport. Great work.
Juerg Feldmann
Comments are closed.