I’ve had my Stryd power meter for a couple months now, have been training with it, and now have done a few races with it. Let’s take a look at the race data.
Race #1: Rescue Run, Jan 1, 2017
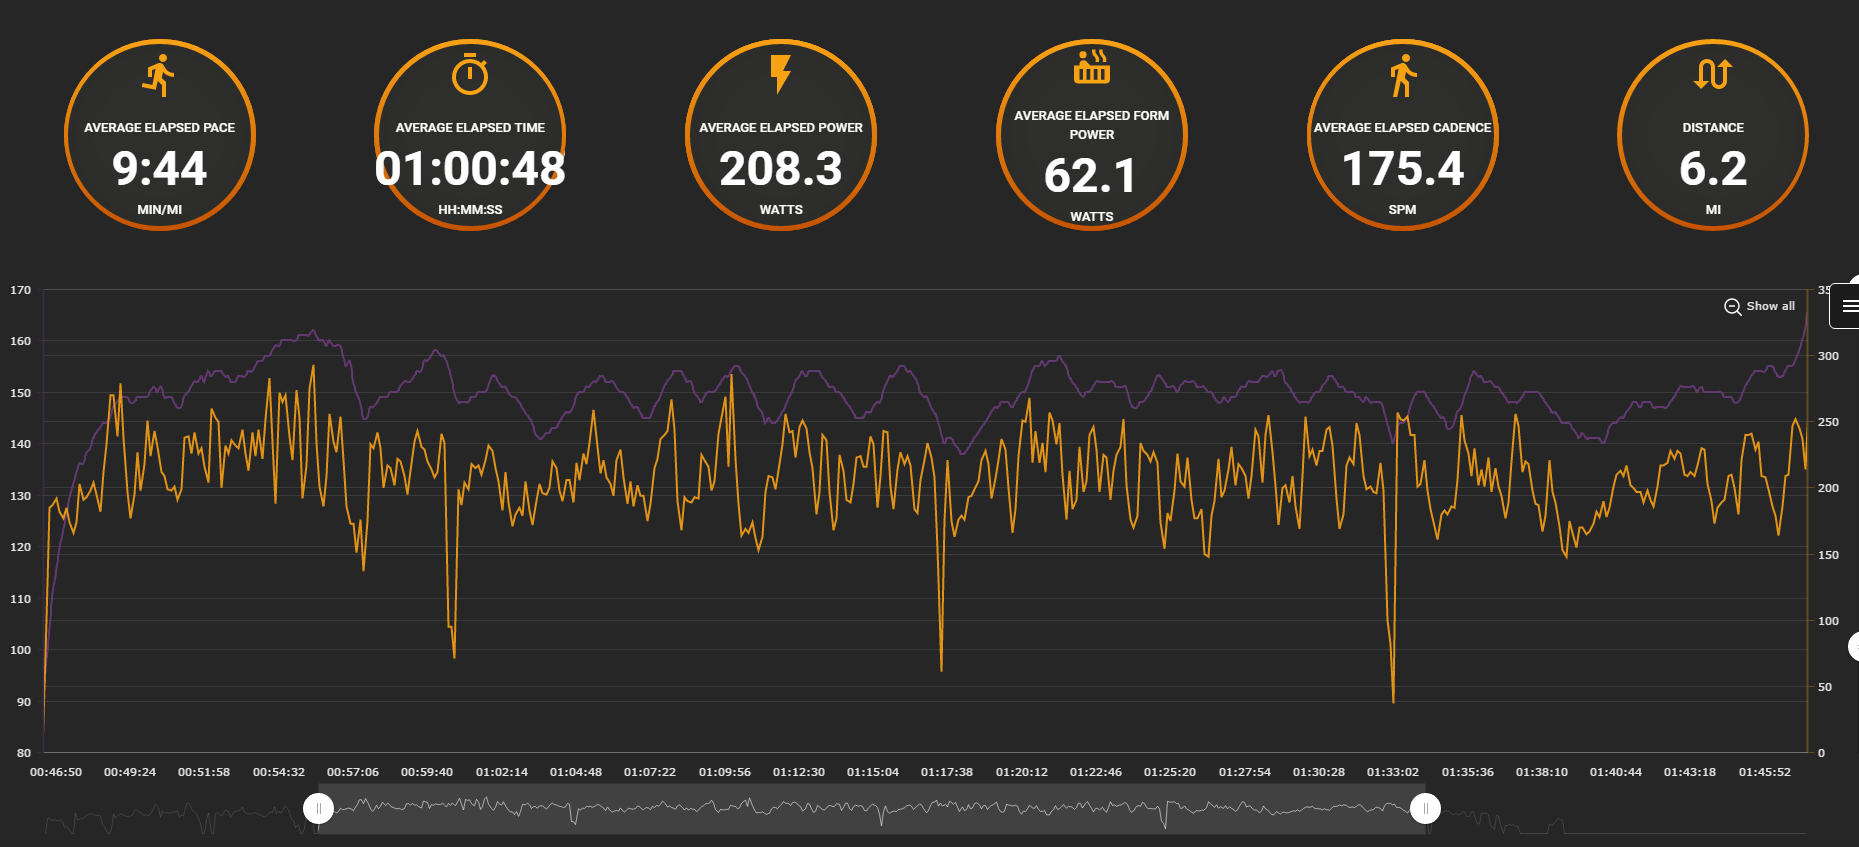
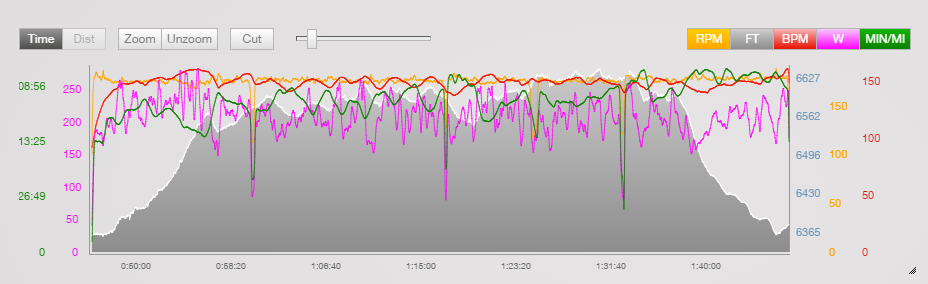
This is a 10k race that was partially paved and partially packed dirt trail. It was quite hilly – the first mile was pretty much all uphill on the park road, the next 4 are rolling, and the last mile is back down the asphalt hill.
My goal for this race was just to run it hard, knowing I had to be careful on the first hill. It was my first time running the race (but not my first time in that park), so I had an idea of the course, but wasn’t exactly sure what would come around each bend. I ran by feel to see what the power numbers would turn out to be.
What we see with that is my power increases on the uphill segments and decreases on the downhill, as is expected. My form power (running in place power) actually goes up when I’m on downhill segments, so I could probably work to make myself a little “lighter” on the downhills, as in those segments, my form power is a higher percentage of my total power.
I had Adam Heaney of Stryd take a look at this race data, and he was able to identify that I seemed to run with the terrain instead of by power (correct). I also was interested in how form power varies from total power, and he said typically in the range of 20-30%, and I was around 30%, so there is room for improvement there.
Race #2: Life Time Fitness Indoor Tri, Jan 8, 2017
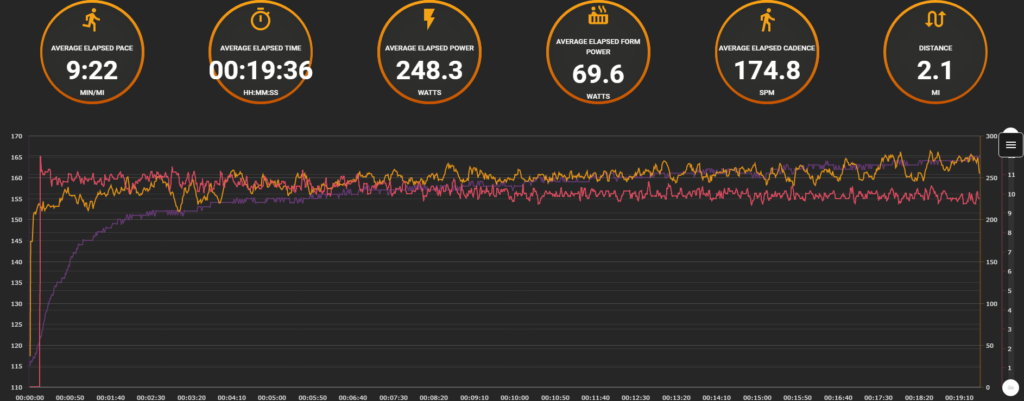
This was a 20 minute treadmill run after a 10 minute swim and a 30 minute bike. While I was probably a little conservative to start, I gave it “a good run” and ramped up the pace across the duration. There are a couple interesting things here. First, my form power stays relatively steady across the whole effort once I get settled in. As expected, power gradually increases with increasing pace as well. But what’s interesting here is the little bit of undulation in my power towards the end… My only explanation at this time would be that I was changing up my stride a bit as the treadmill was getting faster, as I can see some variation in the ground contact time and vertical oscillation data there as well.
While I should have had a specific power target for pacing, as I’d done my critical power test on a treadmill, I was more focused on pace instead. Average power was 248W, and at the upper end of my Z4.
Race #3: Winter Series #1, Cheyenne Mountain State Park, Jan 14, 2017
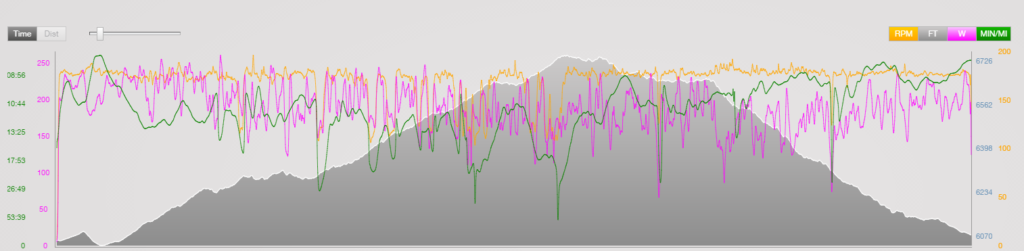
I don’t normally race on consecutive weekends. Especially three in a row! But I wanted this to be a training race for my half marathon (3 weeks later), so a hilly 7 miles seemed like a good idea! Yikes…I knew it was a challenging race, but forgot how much uphill there was! There were also some small icy sections, which required a little caution.
The first half was basically all gain (750ft in 3.4 miles) and the second half was back down.
The goal for this race was to stick to a power number (in the 200-210 range) and try to hold it there. One benefit of a Stryd is to be able to use it to gauge steady effort on trail terrain. I wasn’t quite so good at that. I started out a little too hard (had sections in the 220+ range), and with some of the trail being icy and just plenty steep, I had to forgo trying to maintain a specific power at certain times.
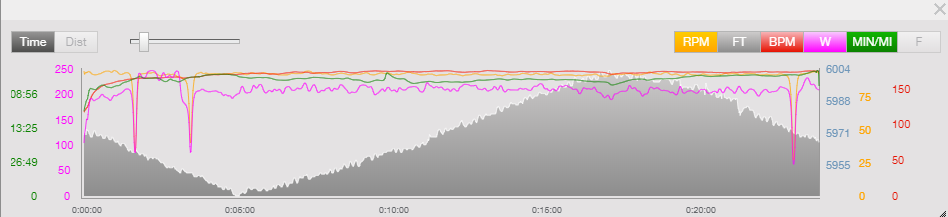
This was definitely a first half not the same as the second half race, so let’s look at each half. Normalized power for the first half was 201W with a 1.02 variability index (pretty steady, especially considering I had to walk some.) Normalized power for the second half was 183W, also with a 1.02VI. I definitely lose power on the downhill, and my form power becomes a higher percentage of my overall power.
Here’s a comparison of the data from the races.
| Rescue Run (1 Jan) | Indoor Tri Run (8 Jan) | Winter Series #1(14 Jan) | |
| Average Power | 208W | 248W | 190W |
| Normalized Power | 212W | 249W | 194W |
| Variability Index | 1.02 | 1.0 | 1.03 |
| Average Form Power | 62.1W | 69.6W | 56.5W |
| % Form Power | 29.8% | 28% | 29.7% |
| Avg Vertical Oscillation | 5.4cm | 6.2cm | 5.9cm |
| Avg Ground Contact | 301ms | 251ms | 361ms* |
| Avg Leg Spring Stiffness | 9.9kN/m | 10.1kN/m | 9.5kN/m |
*walking up steep hills plus walking icy sections influenced this number.
Now that I have some data to compare – two hilly races and a short but strong treadmill effort. If we look at areas for improvement, my percentage form power is consistently on the high end of the typical range, so I probably have room for improvement there with economy. My average ground contact time is also somewhat high, and my vertical oscillation is actually lower than normal. According to running coach Ryan Bolton, GC time is typically 150-300ms, and VO typically ranges from 8-14cm. (Read his power analysis of a marathon run by Patrick Smyth.)
Things that I can do:
Continue to work on hip mobility and incorporate some more power work to be a little more “springy.” I’ve always felt that I was a bit of a “clunky” runner, and with the data from the Stryd, I can take steps to change that and monitor improvement. I can also work on my downhill running form to try to reduce the form power percentage there.
How do you measure your runs? Let me know in the comments below!