I am six days into my Metabolic Efficiency Study, and I’m progressing nicely. At least I’m not having too much trouble sticking with the eating plan. And I’m keeping my exercise aerobic (not too hard since I haven’t done a lot of exercise!) If you missed it, here’s the link to the background of what I am doing and why.
What have I eaten? The main goal is to eat fruits, veggies, lean meats and healthy fats. I eat when I’m hungry and then eat enough to satisfy me for about 3 hours. That’s the goal anyway. I think after the first six days I’ve about got portion sizes figured out. This is a little more challenging because I work so I have to bring my meals ahead of time. The hard part would be if I didn’t bring enough food. To solve this I keep raw nuts with raisins in my desk drawer. A nice little snack to help tide me over before I get home from work to make dinner. Daily details of what I eat can be found on my Banana Death blog. (Yes, I eat a lot of bananas.)
So let’s look at the numbers. TrainingPeaks.com has an easy to use nutrition tracking interface that I found gives me good information for this study. I can then pull a summary for a range of dates and look at many different metrics in a nice graphical view. The “pods” I display are chosen from several options and are customizable. Let’s take a look:
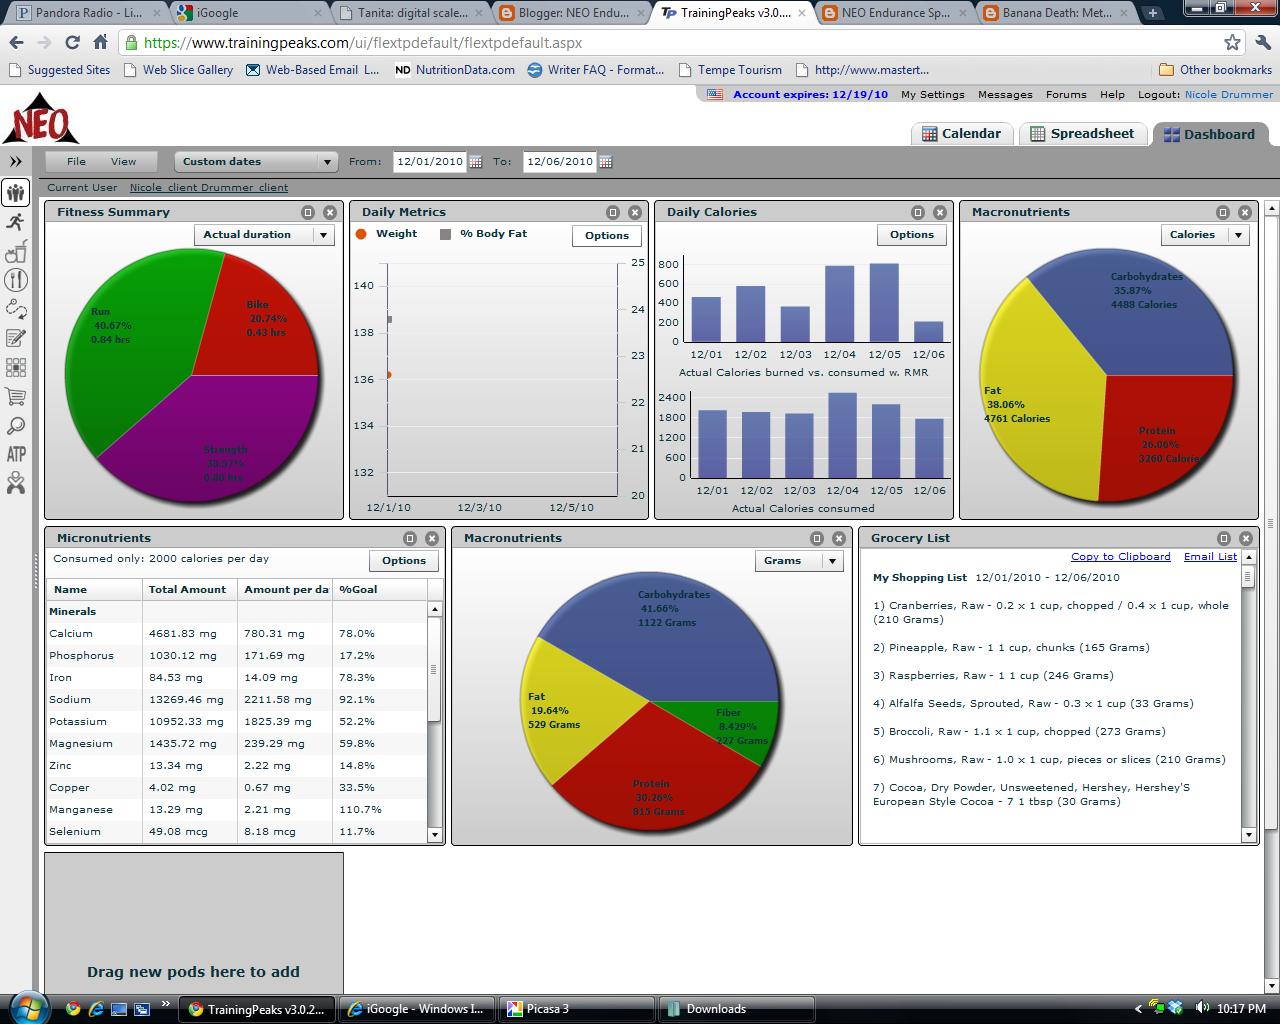 |
| Fig. 1: Screenshot of all my TrainingPeaks “pods” on the dashboard |
Looking below at figure 2, we have two pods. The left pod has two charts. The top one plots daily calories consumed minus burned. TrainingPeaks has a RMR (resting metabolic rate) calculated at 1390 Calories for me. Whether that is accurate, I won’t know without being tested, but it’s probably in the ballpark. And because I haven’t been doing a whole lot of activity this week, the chart shows I’m at a surplus of calories. But I do move around some – I’m not THAT lazy, so the top graph probably isn’t so accurate, my “surplus” is probably less. The bottom chart just shows total calories consumed, so as long as I’m entering the food appropriately, it’ll be pretty close to my actual caloric consumption. You can see I’m eating about 2000 calories a day (going a little over on Sat and Sun due to the holiday parties).
The pie chart to the right just shows the caloric breakdown of all my macronutrients (carb, fat, protein). It’s hard to read, but CHO is 36%, Fat is 38%, and Protein is 26%. I’m probably a little low in the CHO and high in the fat. Something to think about as I plan my meals for week #2.
 |
| Fig. 2: Daily Calories and Macronutrients |
The next chart below is just a summary of my activities that I’ve logged in training peaks. Run: 0.84 hrs, Bike 0.46 hours, Strength 0.8 hours. Like I said, not a lot. Although I think I have a few miles of walking that I didn’t log as a specific workout. I’m using the Daily Metrics pod to track weight and body fat. Since I’m only weighing once a week (Wednesday mornings), I only have the data from the first day. You could enter data daily for trends, but my goal is not to think about my weight, so a weight once a week during the study will be sufficient.
 |
| Fig. 3: Fitness Summary and Daily Metrics |
These next two pods in figure 4 show micronutrients and macronutrients again. I still need to look into the data source of the micronutrients, as it has me well under 100% based on a 2000 calorie diet (that’s configurable) on some of them. It might be dependent on people entering those values into the food database. If so, it probably won’t be accurate. But I just learned about this pod, so I’ll report on it again next time.
The pie chart on the right is macronutrients again, but this time I have it display grams. When in this mode, it includes grams of fiber. I’ve consumed 227 grams of fiber in the last 6 days, which is about 38 grams per day.
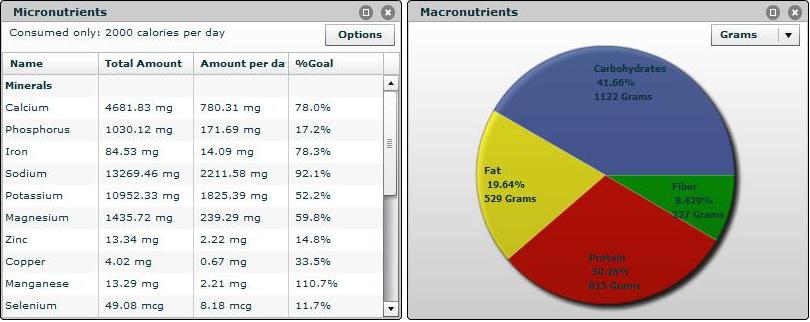 |
| Fig. 4: Micronutrients and Macronutrients |
There is one more pod on the screen that I didn’t get a separate image for, and that is the Grocery List. Training Peaks takes all the components of the meals and foods that were tracked and puts them into a list so you know to get more. I’m not sure how useful this is for me right now, but there is potentially some value to this functionality.
Week 1, Day 6 Summary: It’s actually not to hard to eat a lot of fruit and veggies if I plan ahead and have that shopping list made from recipes that look good. As far as physical changes, it’s a little too early to tell, so I’ll just keep eating and tracking!